HHomeBackground Color:He
LiBeTin Main PageBlack White GrayBCNOFNe
NaMgTin Pictures PageAlSiPSClAr
KCaTin Technical DataScTiVCrMnFeCoNiCuZnGaGeAsSeBrKr
RbSrYZrNbMoTcRuRhPdAgCdInSnSbTeIXe
CsBaLaCePrNdPmSmEuGdTbDyHoErTmYbLuHfTaWReOsIrPtAuHgTlPbBiPoAtRn
FrRaAcThPaUNpPuAmCmBkCfEsFmMdNoLrRfDbSgBhHsMtDsRgCnNhFlMcLvTsOg

Isotopes of Tin (click to see decay chain):
99Sn  100Sn  101Sn  102Sn  103Sn  104Sn  105Sn  106Sn  107Sn  108Sn  109Sn  110Sn  111Sn  112Sn  113Sn  114Sn  115Sn  116Sn  117Sn  118Sn  119Sn  120Sn  121Sn  122Sn  123Sn  124Sn  125Sn  126Sn  127Sn  128Sn  129Sn  130Sn  131Sn  132Sn  133Sn  134Sn  135Sn  136Sn  137Sn 

137Sn    Half-lifeFermion, 50p 87ntitle icon
190 msSpin 5/2 Parity -1

Hide Decay Modes
ProbabilityModeDecay EnergyDaughter
58%β-n6.497MeV136Sb
42%β-9.948MeV137Sb
Hide Ultimate Decay Products
YieldNuclide
19.322982%137Ba
10.354232%135Ba
Unknown136Ba
Unknown134Ba
Atomic Weight136.94599
AbundanceNone
Mass Excess-50.31MeV
Binding Energy8.152MeV
Magnetic MomentN/A
Quadrupole MomentN/A
 
Show Isotope Symbols.
Also show decay chains leading to this isotope.
Show only decays with probability >0.1%.
Click any isotope in diagram to see its data.
Decay Chain Image

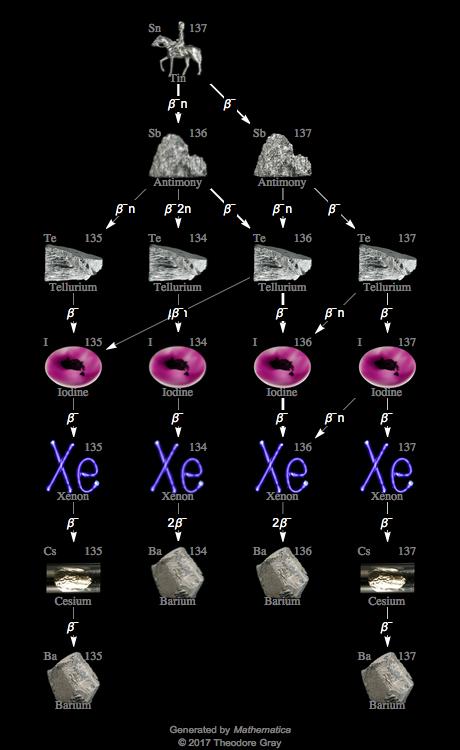
Decay chain image generated by Mathematica's GraphPlot and IsotopeData functions from Wolfram Research, Inc..